


When I pitched this article to my graphic designer wife, she looked at me like I was speaking in tongues. However, I can't think of a more concise title. What this article will ultimately discuss is how something as seemingly non-quantitative as color can actually be represented as linear data and thus have linear operations applied. One such operation is finding how close two colors are to each other. If that is more interesting than the title suggests, keep reading.
Qualitative Data vs. Quantitative Data
First some definitions of data:
- Qualitative data is data that characterizes, describes, or otherwise expresses the quality of something. It tends to be non-numeric in nature.
- Quantitative data is data that expresses amounts, measurements, or otherwise can be quantified.
The values "large", "medium", and "small" are qualitative because they do not represent quantifiable values on a number scale even though they have an obvious relationship. In the USA, most Jeans are measured by waist size in inches. A measurement in inches is a quantitative value. It doesn't make sense to say that "small" is half that of "large". Whereas, it does make sense to say a 25 inch waist is half that of a "50 inch waist".
🤷 Aside: When trying to come up with an example, my wife tried to explain how women's clothes sizing works... It's a nonsensical nightmare using numbers in a qualitative way.
N-Dimensionality
Next, let's discuss multiple "dimensions". No, this won't cover quantum physics or the Teenage Mutant Ninja Turtle multiverse. In algebra, a dimension is simply a collection of values needed to represent a point in a space.
- One dimensional space is a line where a single value is needed to represent position on that line. Think of a tape measure.
- Two dimensional space is a plane where two values are needed to represent position on the plane. Think of Geo coordinates or height and width.
- Three and higher dimensional spaces do not have a nice mathematical names. However, in general, depending on the dimensionality N, to represent a position in N space, you need N values.
One thing worth noting is that each dimension N is a subset of dimension N+1. That is to say a 1D line exists within a 2D plane. A 2D plane exists within a 3D space. All 3D spaces existing within a 4D space and so on. In the example of a line, there is only one dimension we care about. All the other dimensions still exist, they just have a value of 0 when describing that point in space.
Euclidean Distance
You probably learned the "distance formula" in basic algebra for finding the distance between two points on a 2D graph. Here is a review:
𝑑=sqrt((𝑥2−𝑥1)^2+(𝑦2−𝑦1)^2)
Essentially, you square the difference in x values, add it to the square of differences in y values and then take the square root of that sum.
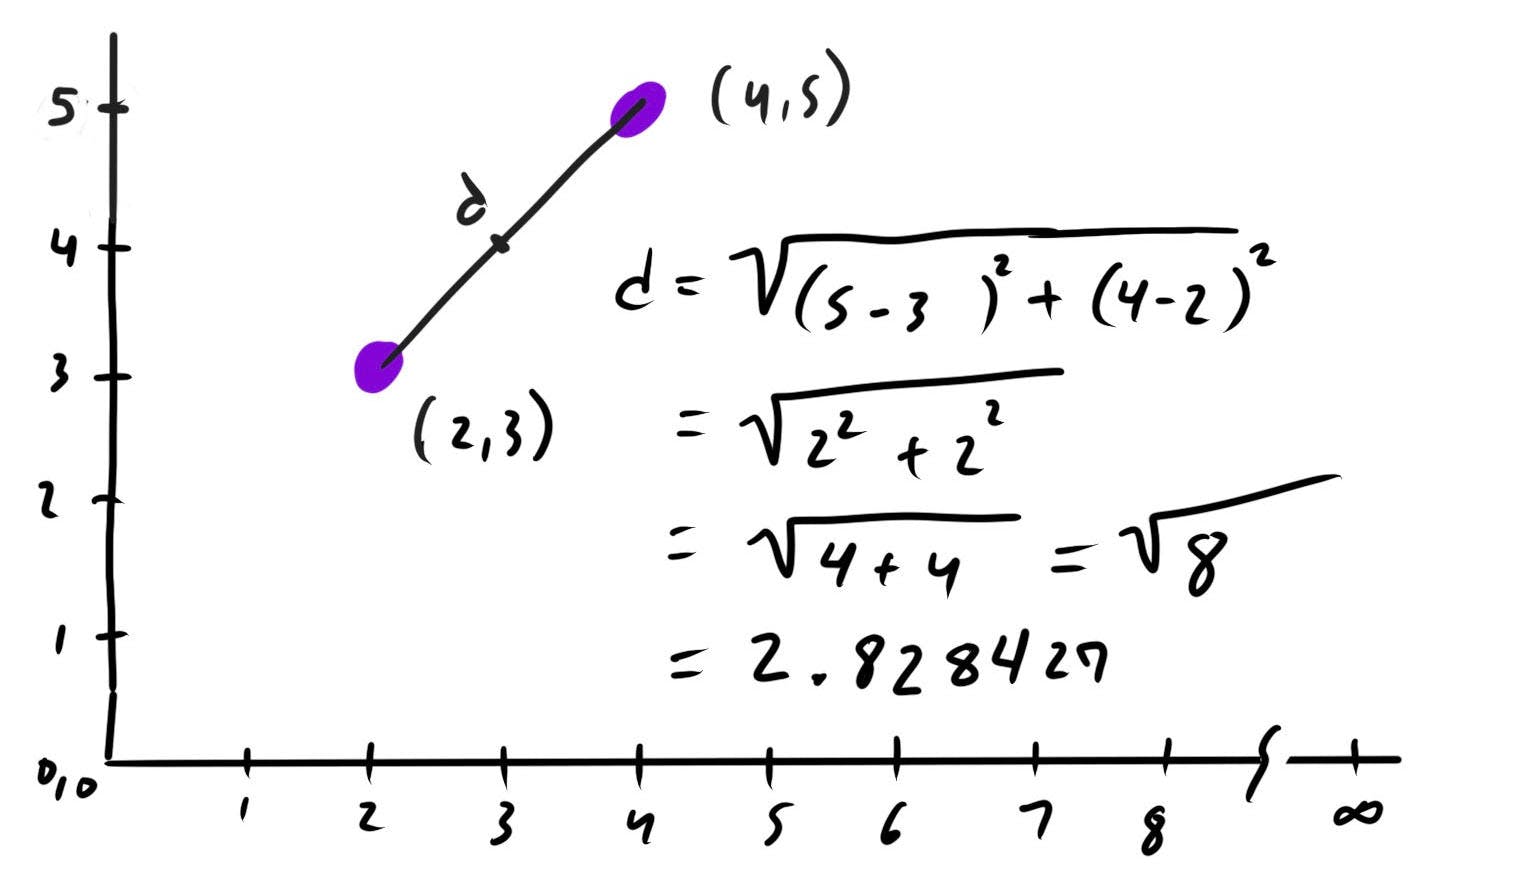
For example, given, p1 = (2, 3) and p2 = (4, 5), applying the distance formula gives:
 => sqrt((4-2)^2 + (5-3)^2)
 => sqrt(2^2 + 2^2)
 => sqrt(4 + 4)
 => 2.828427
 Next, think about distance in 1 dimension (a line). Intuitively, the distance between two points is a simple subtraction. However, let's apply the distance formula in 1 dimension. To do this, remember the aforementioned bit about a 1D line being a subset of a 2D plane.
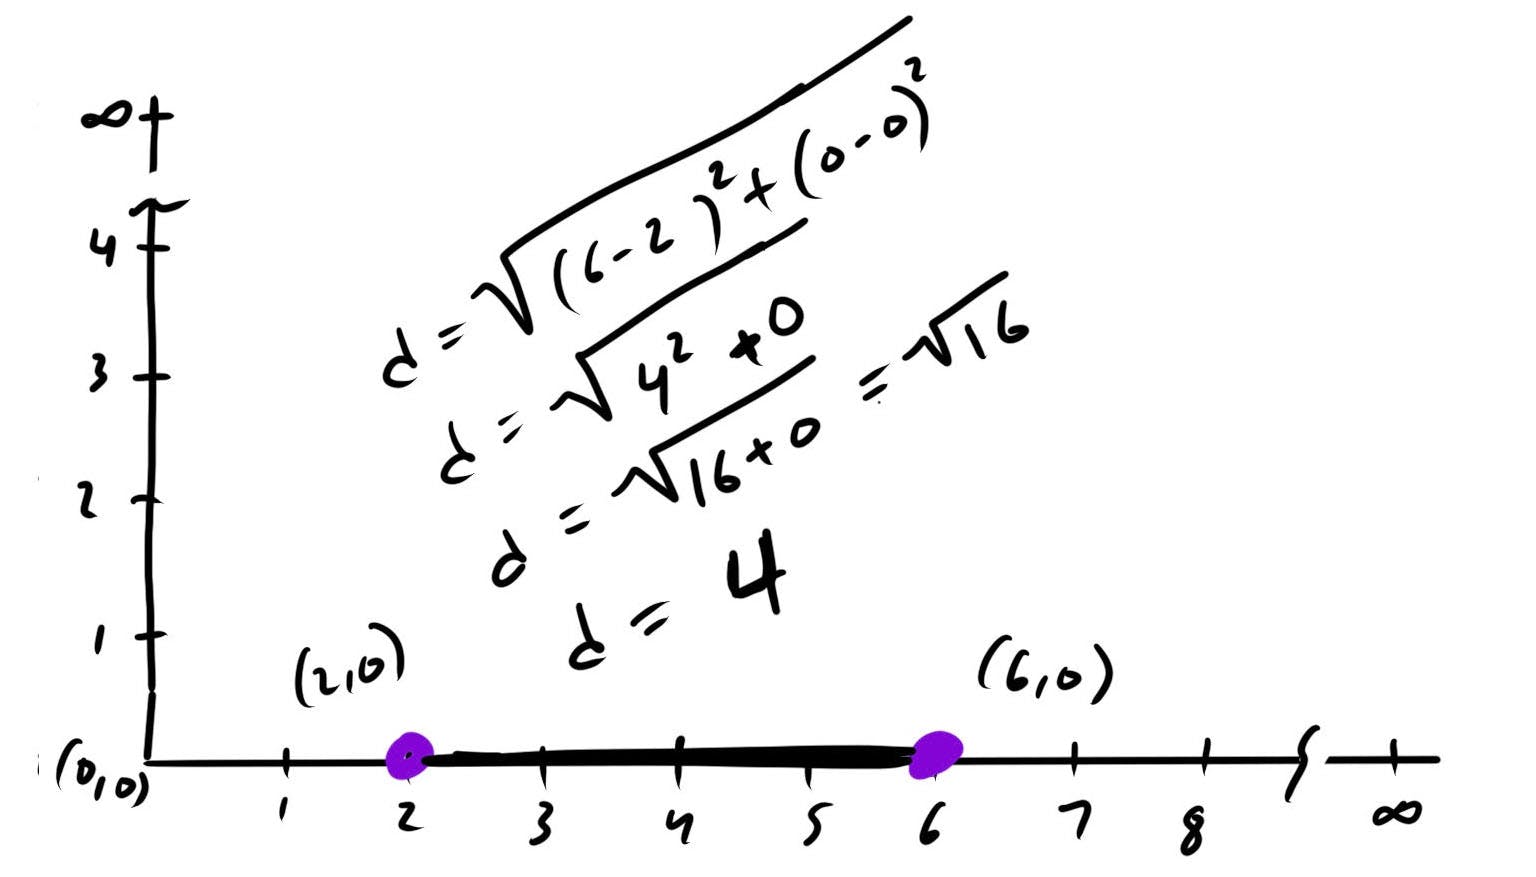
For example, given the points on a line x1 = 2 and x2 = 6, we can express this as 2D points p1 = (2, 0) and p2 = (6, 0). Note: The y values are 0.
 => sqrt((6-2)^2 + (0-0)^2)
 => sqrt(4^2 + 0^2)
 => sqrt(16 + 0)
 => 4
This should make intuitive sense. However, notice the y related term (0-0)^2 evaluates to 0. This is because there are no y values. If we eliminated that term completely, the formula would become:
𝑑=sqrt((𝑥2−𝑥1)^2)
Since the square root and the square cancel each other out, we get the intuitive formula for d = 𝑥2−𝑥1.
If distance in one dimension is 𝑑=sqrt((𝑥2−𝑥1)^2) and distance in two dimensions is 𝑑=sqrt((𝑥2−𝑥1)^2 + (𝑦2−𝑦1)^2) we simply need to keep adding terms for each dimension N.
𝑑3=sqrt((𝑥2−𝑥1)^2 + (𝑦2−𝑦1)^2 + (z2−z1)^2)
𝑑4=sqrt((𝑥2−𝑥1)^2 + (𝑦2−𝑦1)^2 + (z2−z1)^2 + (t2−t1)^2)
𝑑n=sqrt((𝑥2−𝑥1)^2 + (𝑦2−𝑦1)^2 + (z2−z1)^2 + ... + (n2−n1)^2)
Colors as Quantitative Data
A color, such as "purple" or "orange" is qualitative data using the above definitions. However, you are almost surely familiar with HTML hexadecimal notation or RGB notation. Both systems represent colors as 3 values (red, green, blue), each on a scale from 0 - 255. A color is thus 3 dimensional data! Assuming each of the three values can be in the range of 0 - 255, then there are over 16 million unique colors using these representations (256 x 256 x 256 = 16777216). This is also known as 24 bit or True Color).
🧠 Note: A hexadecimal number is merely a value in the range of 0-15 (represented as 0-F). A two digit hexadecimal number (0-FF) can represent 16 different values per digit (including 0). Thus, a two digit hexadecimal can represent 256 different values (16x16 or 16^2). As such, HTML hexadecimal color codes are just a convenient syntax for representing r,g,b format into a single base 16 number. #FFFFFF is the color "white" but also the decimal number 16777215.
The w3c defines 140 named colors for the web. Part of defining these is to assign quantitive r,g,b values to qualitative color names.
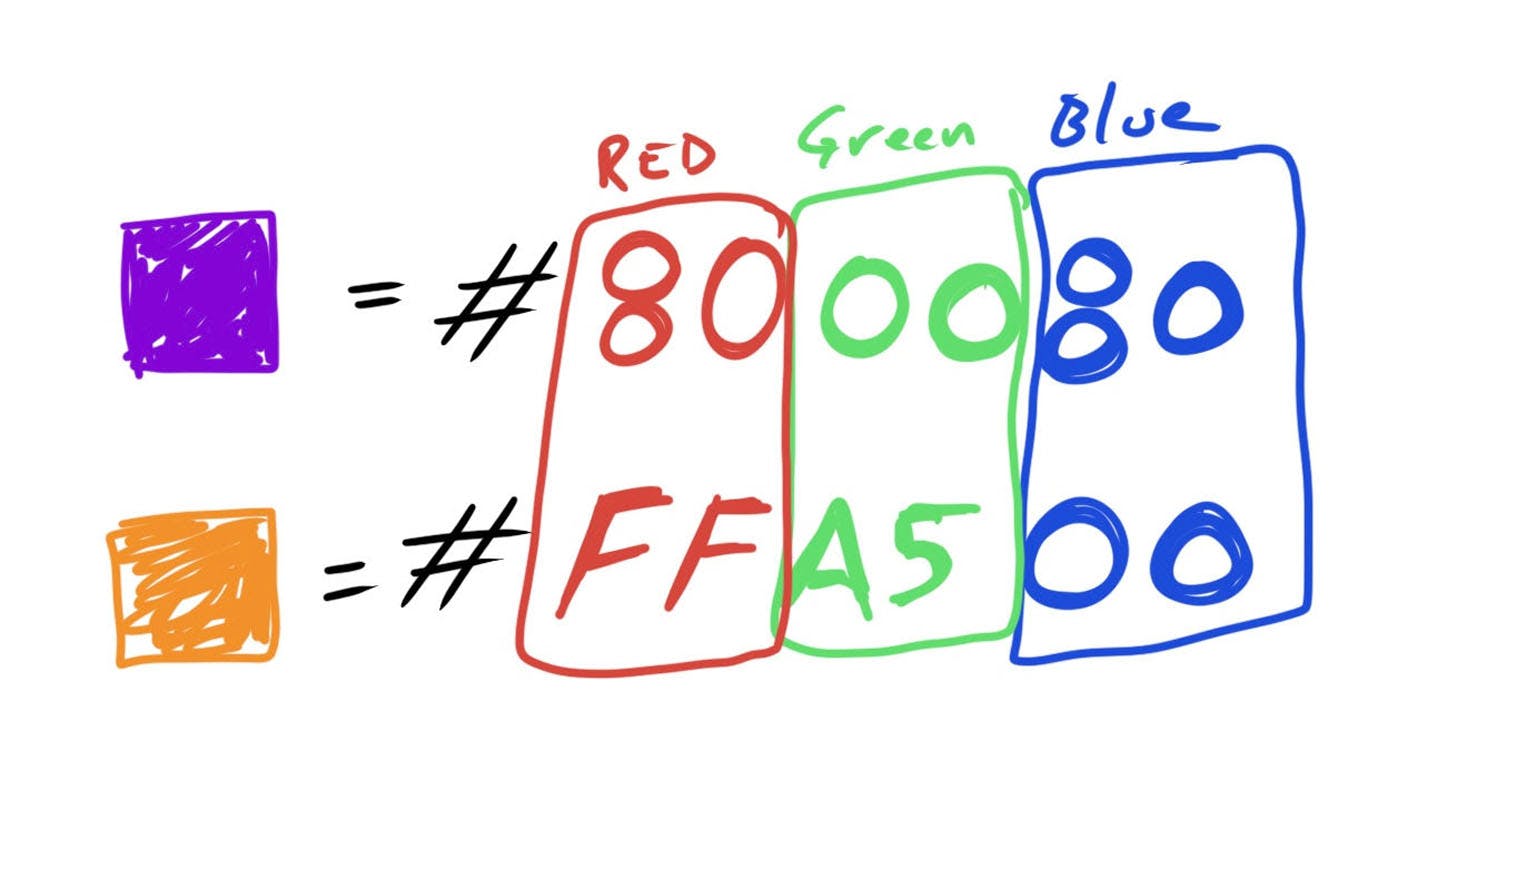
- "Purple" becomes "#800080" in Hex or (128, 0, 128) in r,g,b
- "Orange" becomes "#FFA500" in Hex or (255, 165, 0) in r,g,b
Finding the "Distance" Between Two Colors
To recap, we know how to represent colors as 3 dimensional data. We also know how to find distance in 3 dimensions. Applying what we learned, we can now find the "distance" between two colors.
distance("orange", "purple")
=> distance((255, 165, 0), (128, 0, 128))
=> sqrt((128 - 255)^2 + (0 - 165)^2 + (128 - 0)^2)
=>sqrt(16129 + 27225 + 16384)
=> 244.413583911
The difference between "orange" and "purple" is quantifiable and measurable. I don't know about you, but I think this is pretty neat.
Some Code
Below is the distance formula in TypeScript. It allows finding the difference between two points of different dimensions assuming one point is a subset of the other.
const distance = (p1:number[], p2: number[]): number => {
    const maxDimension = p1.length > p2.length ? p1.length : p2.length

    let i = 0;
    let sum = 0.0;
    let n1 = 0.0;
    let n2 = 0.0;

    while (i < maxDimension) {
        n1 = p1[i] || 0;
        n2 = p2[i] || 0;
        sum = sum + Math.pow(n2 - n1, 2);
        i++
    }

    return Math.sqrt(sum)
}
Using it to find the difference between "orange" and "purple":
distance([255, 165, 0], [128, 0, 128]) // 244.4135839105511
Naive Image Quantization
According to Wikipedia, Quantization, in general, is the process of constraining an input from a continuous or otherwise large set of values to a discrete set. In graphics, quantization is used to apply a limited palette of colors to an image.
A brute force (aka naive) approach to image quantization is as follows:
- Given a palette of colors represented as a list of 3D r,g,b values AND
- Given an 2D image where each x,y coordinate is a pixel with a single 3D r,g,b value
- For each x,y pixel in the image
- calculate the distance between the pixel r,g,b value and each r,g,b value in the palette
- The palette color that has the shortest "distance" to the image pixel is the new replacement color.
Note: I say this approach is naive, because it is terribly inefficient. Algorithms such as median cut do a far more performant job by leveraging value ranges to reduce the number of calculations required.
Some Code
The algorithm for finding the color in a palette closest to a target pixel color is as follows:
type RGB = [number, number, number];
const closestColor = (color:RGB, palette: RGB[]): RGB => {
    let minRGB: RGB = palette[0];
    let minDistance = Infinity;

    let i = 0;
    let paletteSize = palette.length;
    let iDistance = 0;
    for (i = 0; i < paletteSize; i++) {
        iDistance = distance(color, palette[i]);
        if (iDistance < minDistance) {
            minDistance = iDistance;
            minRGB = palette[i];
        }
    }
    return minRGB;
}
For brevity, I won't include the TypeScript version of the naive quantization algorithm. Since, it is dependent on the storage structure of pixels for image data (i.e. HTML5 canvas uses a flatUint8ClampedArray which might merit its own article).
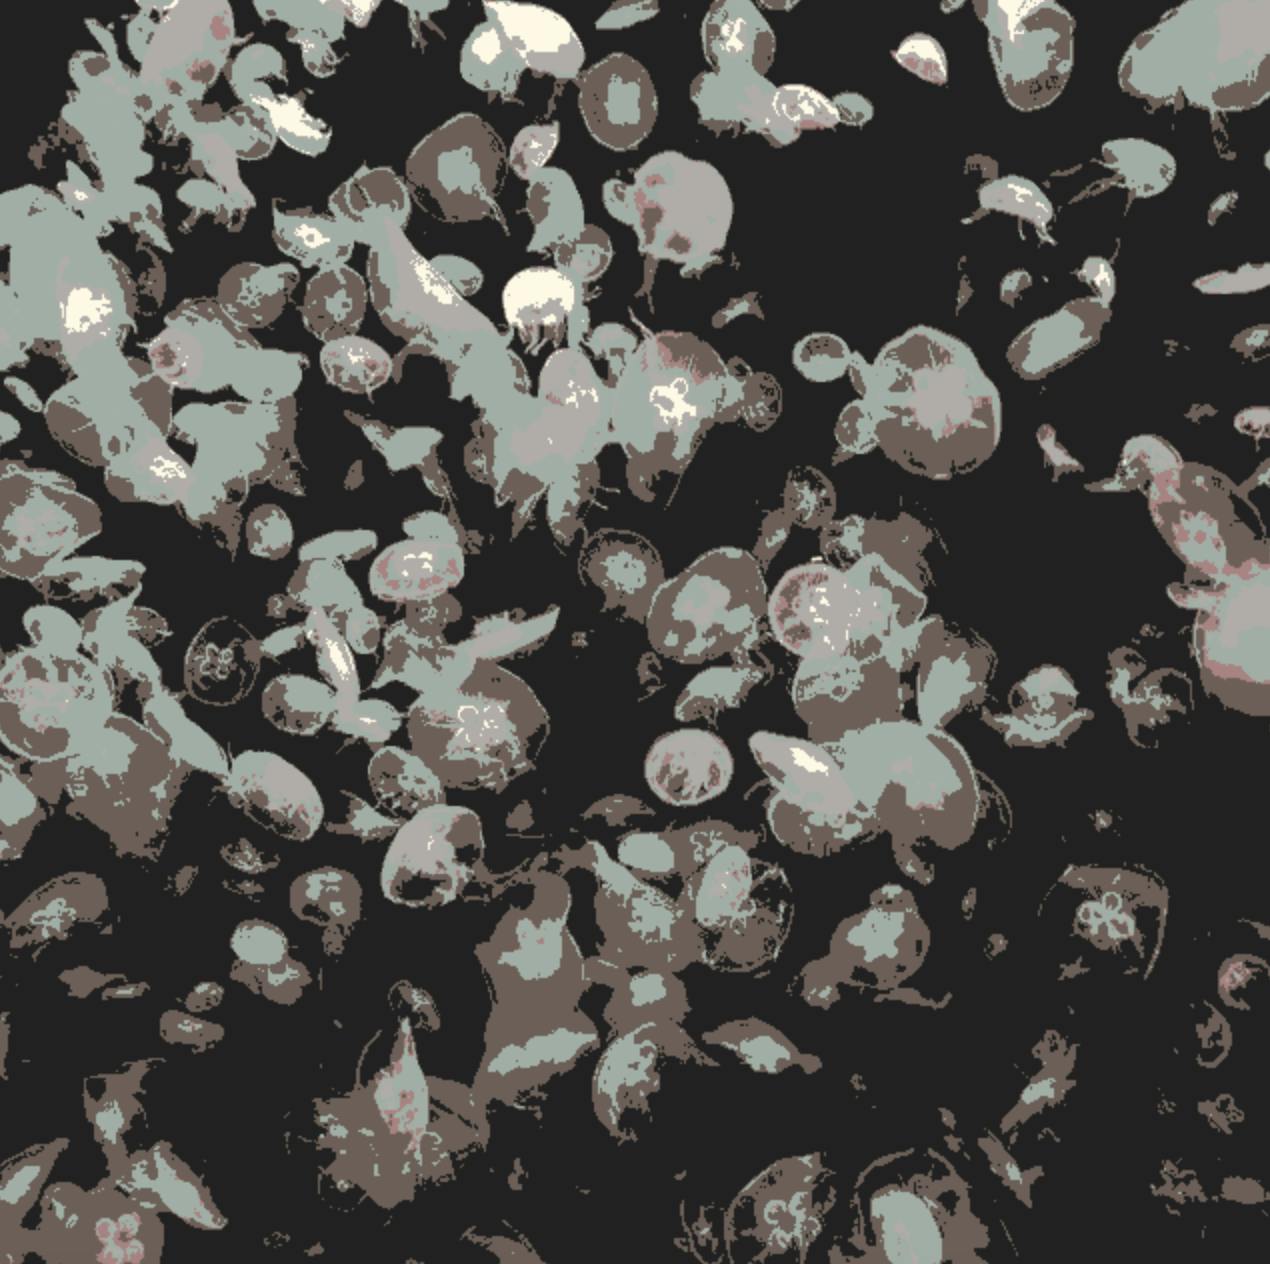
However, here is the Jellyfish image for this post quantized to a palette of spray paint colors I have in my garage:
Conclusion
As we have seen, colors can be quantified into 3 Dimensional space and have algebraic operations applied to them. I did not take graphics in college, and when I discovered this, it rocked my world.
As an artist, I learned this while writing a program to do color separations for making stencils. Home Depot publishes the Hex codes for their Rustoleum 2x Spray paint. I then wrote a program to quantize an image based on my inventory of Rustoleum paint. You can see this in action on this complementary HTML5 canvas code lab example on my site.
Part of the reason I love topics like these is that they pull together programming, math, computer science and art. If you like these sorts or articles, let me know in the comments and I'll keep writing them. Check out my series: Applied Math for other ways math pops up in software development.
Image Credit: Photo by Alison M from Pexels